metasphere
tool
research explorer
updated 14.07.2020
With the aim of making existing and future research and insights on the novel corona virus more accessible, metasphere is working on tools to help researchers navigate and make better sense of the growing corpus of scientific literature.
As research into COVID-19 is surging and a multitude of routes are being explored, the volume of produced papers makes maintaining oversight over the current state of research challenging. With the aim of getting new research teams working on COVID-19 related topics up to speed faster, an international group of volunteers is building a visual experience to provide a landscape of the current research as well as tools to enable researchers to collectively work through the amount of information being produced at faster rates and more effectively.
Mapping the information space
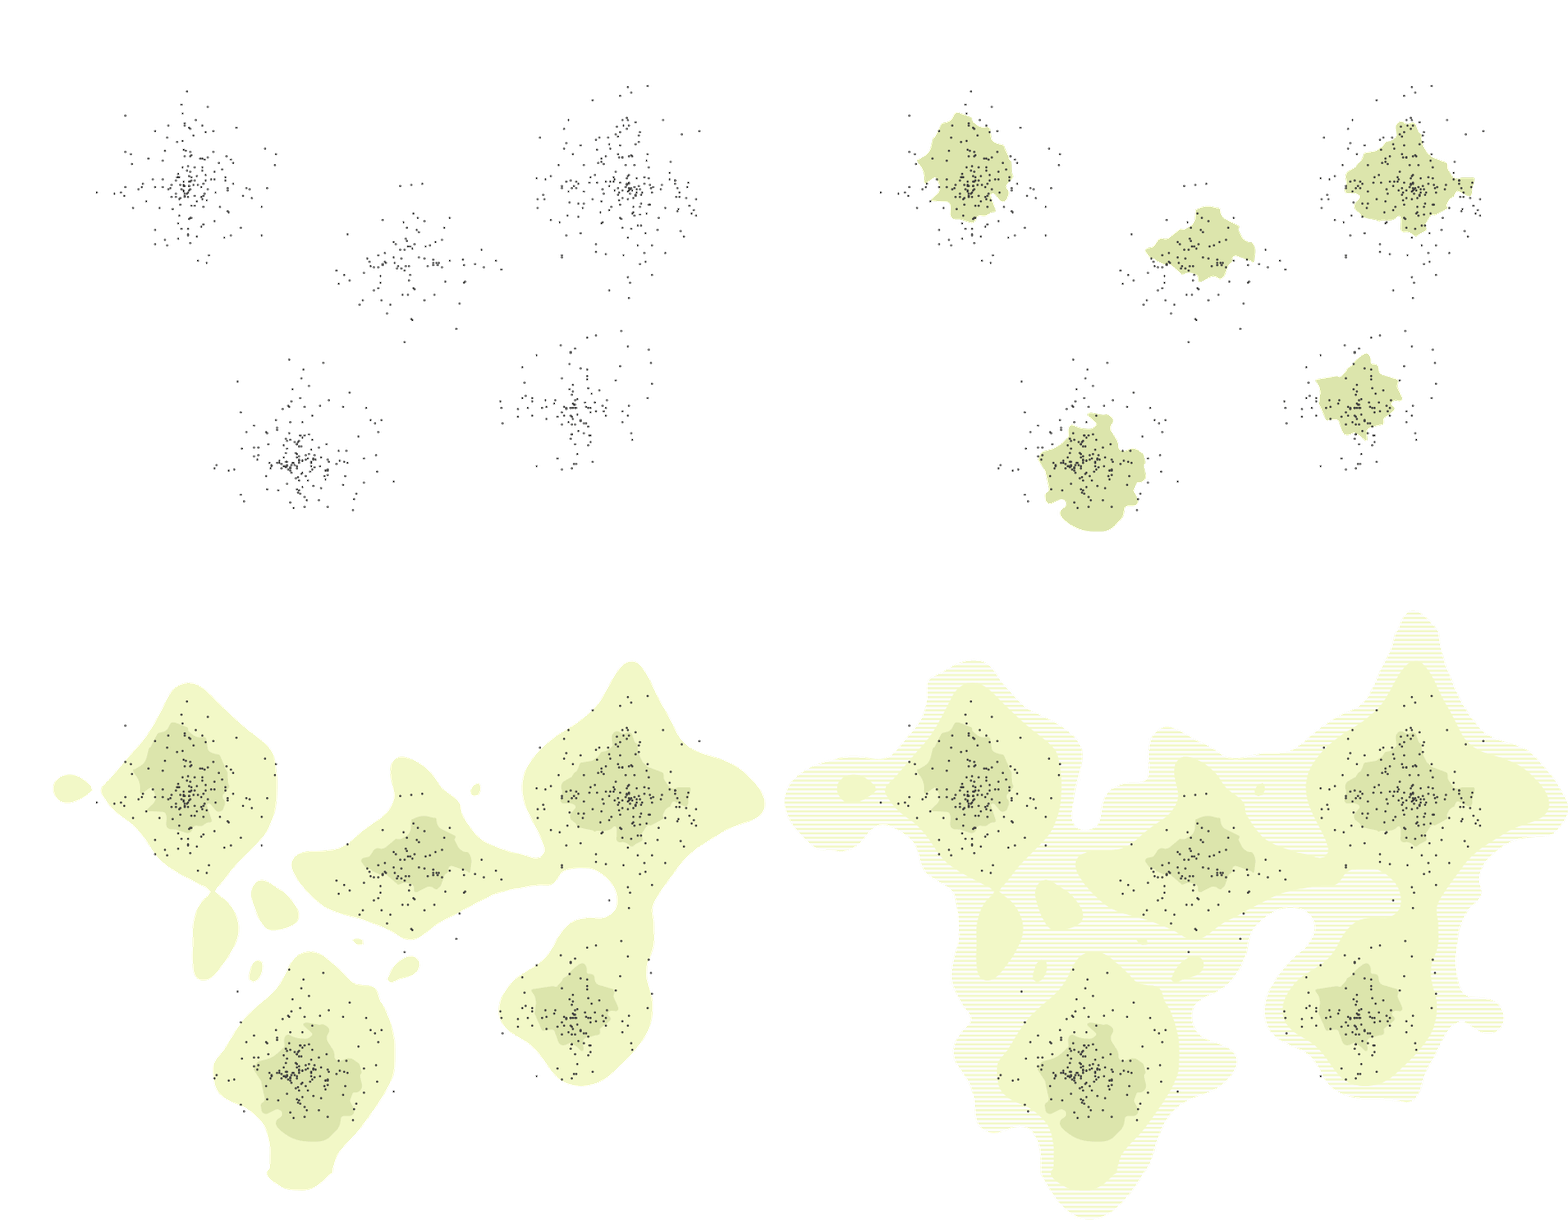
To make the complex corpus of research papers on COVID-19 more accessible, our approach is to cluster papers according to their semantic similarity and plot them on a map, thereby making the research landscape explorable as a whole.
We are currently working with the CORD-19 dataset which consists of roughly 30,000 articles. When trying to make such a large corpus of documents visually navigable in its entirity while accounting for a large number of interrelations between the papers, the complexity makes it hard to make sense of most visualizations. Our approach is to visualize clustered objects, forming interconnected networks, in a way that makes exploration more effortless – by utilizing the design of geospatial maps.
Geospatial map of clustered papers:
landforms and topography make it easier to distinguish clusters of similar papers.

Visualizing the research landscape on a topographic map gives the benefits of building on well-learned navigational patterns in order to make the corpus navigable in the literal sense. Researchers can pan around to explore the landscape, zooming in and out to explore topical clusters. Additionally this form of visualization gives us an ability to encode structural attributes of the corpus (i.e. relevance of authors/papers, citation structure of connected papers, etc) in spatial features (i.e. size, elevation or proximity).
Moreover, adding heterogenous visual clues by placing the content on landforms, let’s us address the problem of uniformity in complex network visualizations. Common representations of clusters using uniform visual indicators such as colored dots tend to overwhelm the reader because they are not able to tell those indicators apart. This makes what appears to be “simple” network visualizations hardly comprehensible when visualizing a large number of interrelations. With humans being good at picking out patterns in seemingly random noise, we give the reader forms to visually latch on to, thereby making it easier to distinguish on what topical “continent” a certain piece of information “lives”.
The team
We are an international group of collaborators from diverse backgrounds. We found together through a hackathon on COVID-19 related projects where we started working on a protoype of the research explorer. Now we are continuing our efforts with the goal of creating a tool to help scientists extract knowledge out of vast information landscapes.
Julian Fleck
Julian is a design director and strategist working at the intersection of design and technology. He initiated metasphere as a design approach for navigating complexity and shapes the longterm strategy and focus of the project.
⟶ website
Yashar Mansoori
Yashar is a social researcher by training and has been working at the nexus of technology, strategy and education. He has mainly focused on theories of human action and in particular on the behavioral influences of structured methodologies in inciting action and the modifications they bring about on personal theories of thought and action.
Kikuo Emoto
Kikuo is a software developer having expertise in a wide variety of programming languages. He helps implementing visualization algorithms as well as building the backend architecture of the project. He is specifically interested in serverless architectures and single page applications.
⟶ github
Dario Aschero
Having studied computer sciences and worked as a developer in the web industry, he shifted his focus to the design field. For metasphere he is contributing as an interface and information designer. In his spare time he is researching on how to apply compositional methodologies of book design to responsive web design paradigms.
Ewa Knitter
As an epidemiologist, Ewas overarching goal is to contribute to disease prevention through disease surveillance and research efforts. She has experience working on various domestic and global projects in academia, NGOs, and local health departments. Her specific interests include infectious disease surveillance and spatial epidemiology.
In addition to the currently active team, contributions to this project have been made by Beatriz Yumi Simões de Castro, Donatus Herre, Agnes Ferenczi, Celine Kuttler, Anja Krivograd, and Andrea Giacobino.
Thank you all a lot ♥